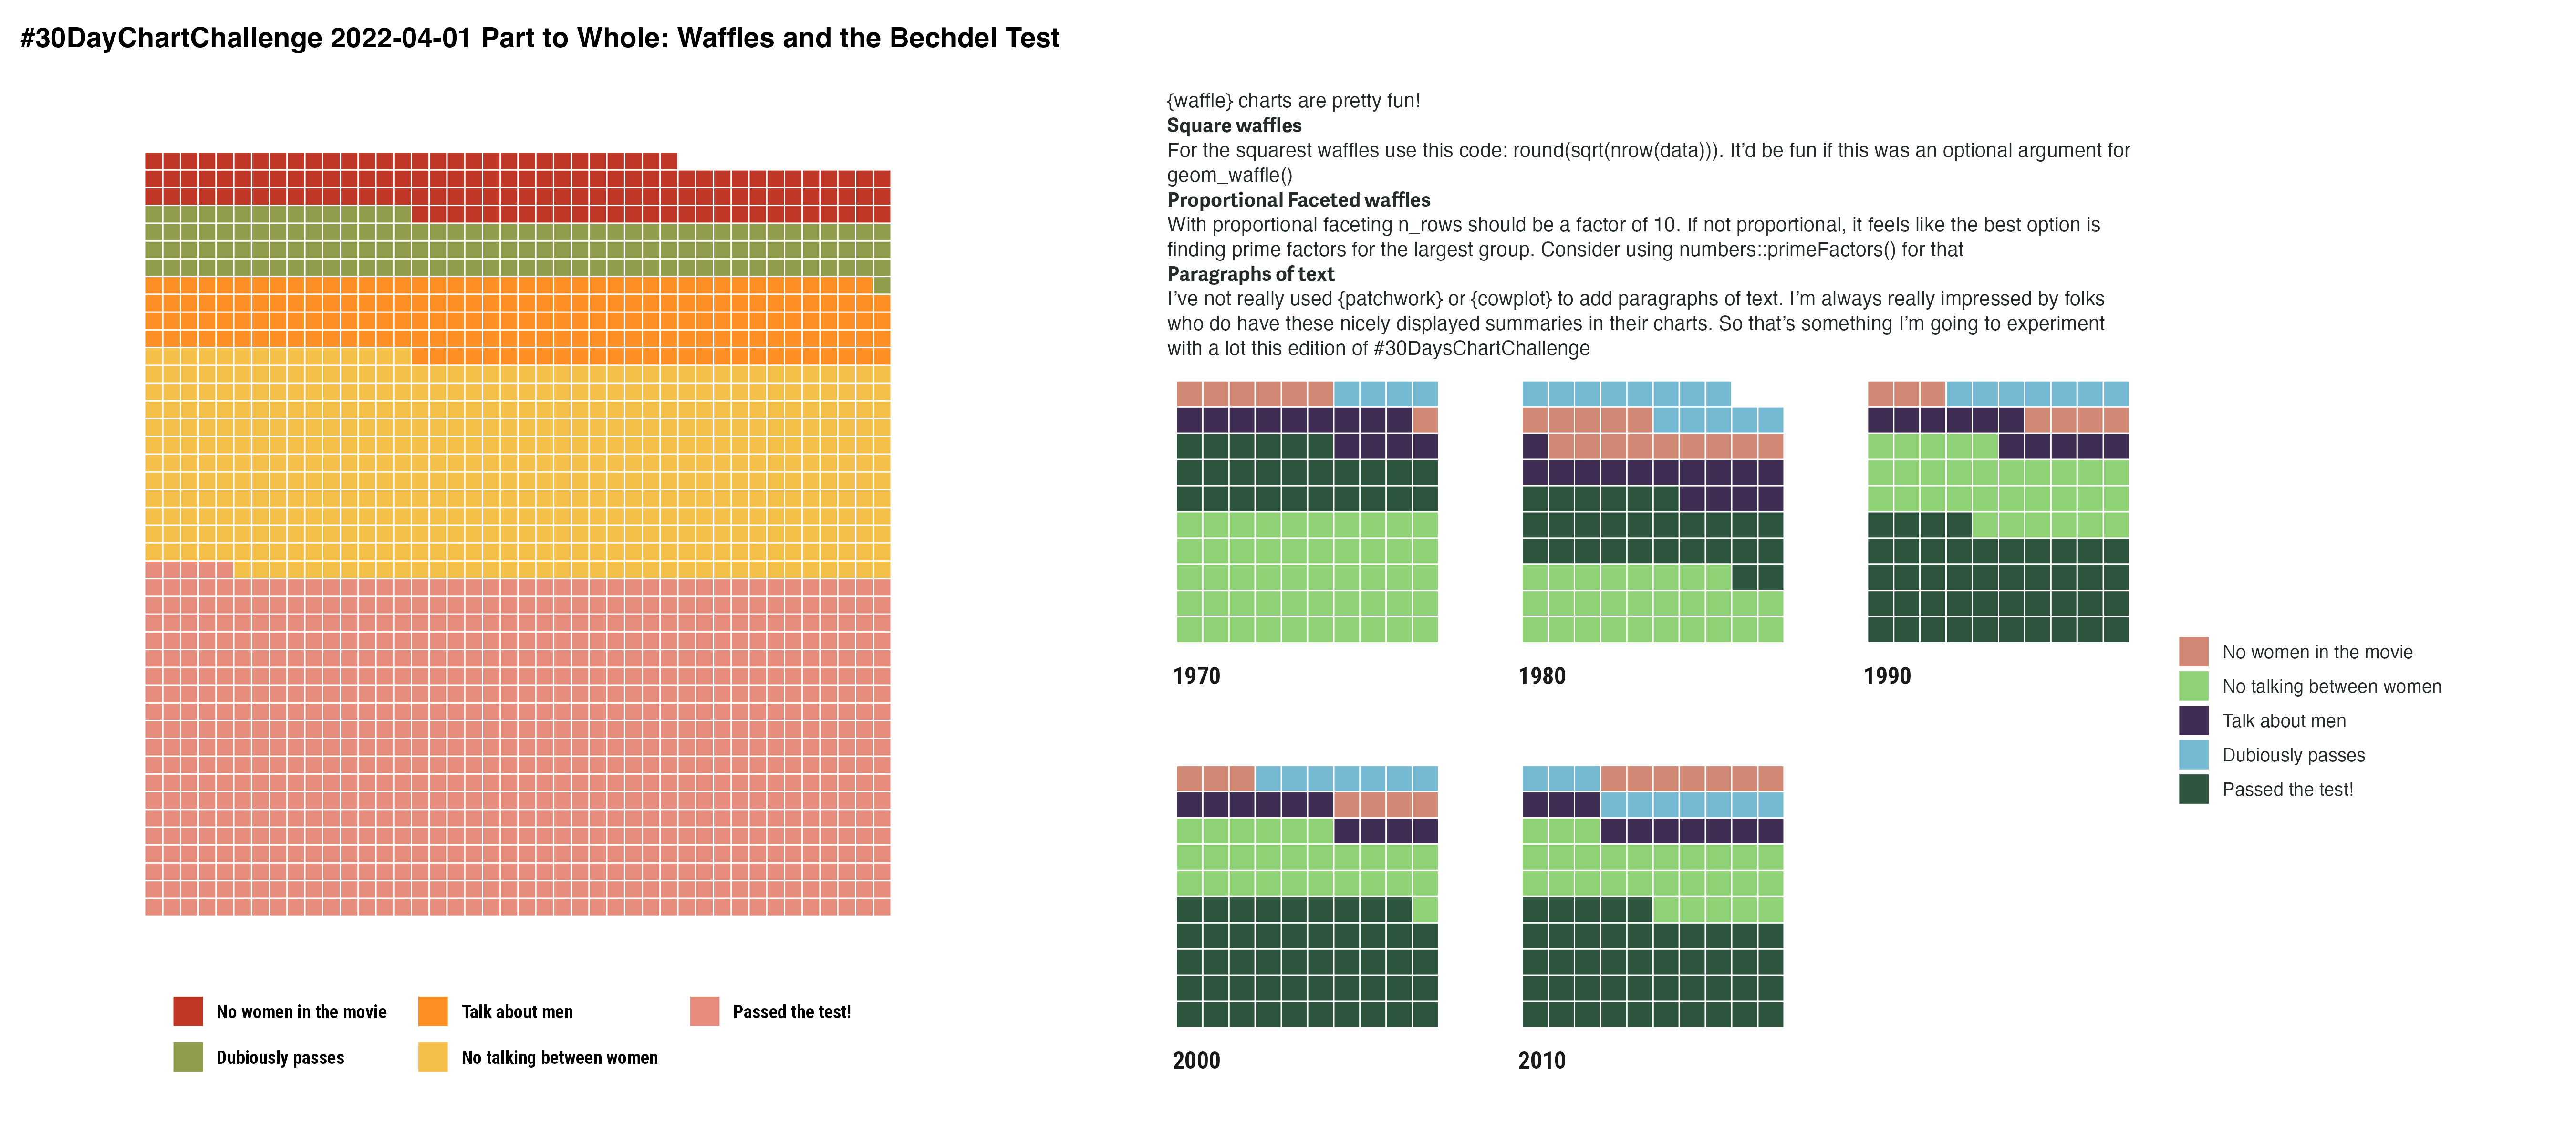
Today’s #30DayChartChallenge is “part-to-whole” and I decided to use it as an opportunity to make a waffle chart as I’ve never done it before. I’m going to try not to use the fivethirtyeight::bechdel dataset for every challenge, but I do really like it.
So let’s start by counting how many films fit into each test category, and tidy these up:
bechdel_count_clean_test <- bechdel |>count(clean_test)label_tests_vec <-c("nowomen"="No women in the movie","notalk"="No talking between women","men"="Talk about men","dubious"="Dubiously passes","ok"="Passed the test!")label_tests_tib <-enframe(label_tests_vec) |>rename(clean_test = name, test_label = value)bechdel_count_clean_test <- bechdel |>count(clean_test, sort =TRUE) |>left_join(label_tests_tib) |>mutate(test_label =fct_reorder(test_label, n))bechdel_count_clean_test |> knitr::kable()
clean_test
n
test_label
ok
803
Passed the test!
notalk
514
No talking between women
men
194
Talk about men
dubious
142
Dubiously passes
nowomen
141
No women in the movie
Looks to me like the {waffle} package is the best for making waffle charts with {ggplot2} but there are alternatives too.
It was fun when making this to explore with different shapes of the chart. I initially played around with prime factors of nrow(bechdel) but eventually settled on the most square possible chart via round(sqrt(nrow(bechdel))).
Let’s do this by decade. Again, it was fun to experiment with different n_rows() values. It feels to me like the best option is to use prime factors of the decade with most observations, which became 7 × 2.
I hadn’t really experimented with {cowplot} for adding text annotations alongside charts. Here’s the final combined layout:
gg_bechdel_waffle <- bechdel_count_clean_test |>ggplot(aes(fill = test_label, values = n)) +geom_waffle(n_rows =round(sqrt(nrow(bechdel))),size =0.33,colour ="white",flip =TRUE,show.legend =TRUE ) +scale_fill_brewer(palette ="Set2", name ="") +guides(fill =guide_legend(nrow =2)) +coord_equal() +theme_ipsum_rc(grid ="") +theme_enhance_waffle() +theme(legend.position ="bottom")gg_bechdel_decade_prop <- bechdel_by_decade |>mutate(test_label =fct_relevel(test_label, label_tests_tib$test_label)) |>ggplot(aes(fill = test_label, values = n)) +geom_waffle(n_rows =10,size =0.33,colour ="white",flip =TRUE,show.legend =TRUE,make_proportional =TRUE ) +facet_wrap(~decade, nrow =2, strip.position ="bottom") +scale_fill_ipsum(name ="") +labs(subtitle =paste("{waffle} charts are pretty fun!","<br>","<b>Square waffles</b>","<br>",str_wrap("For the squarest waffles use this code: round(sqrt(nrow(data))). It'd be fun if this was an optional argument for geom_waffle()",20 ),"<br>","<b>Proportional Faceted waffles</b>","<br>","With proportional faceting n_rows should be a factor of 10. If not proportional, it feels like the best option is finding prime factors for the largest group. Consider using numbers::primeFactors() for that","<br>","<b>Paragraphs of text</b>","<br>","I've not really used {patchwork} or {cowplot} to add paragraphs of text. I'm always really impressed by folks who do have these nicely displayed summaries in their charts. So that's something I'm going to experiment with a lot this edition of #30DaysChartChallenge","<br>" ) ) +coord_equal() +theme_ipsum_rc(grid ="") +theme_enhance_waffle() +theme(plot.subtitle =element_textbox_simple(size =10,padding =margin(2, 2, 2, 2),margin =margin(0, 0, 2, 0),lineheight =1.25 ),text =element_text(colour ="#242c28", family ="Arvo") )plot_grid(ggdraw() +draw_label("#30DayChartChallenge 2022-04-01 Part to Whole: Waffles and the Bechdel Test",fontface ="bold",x =0,hjust =0 ) +theme(plot.margin =margin(0, 0, -10, 10)),plot_grid( gg_bechdel_waffle, gg_bechdel_decade_prop,nrow =1,rel_widths =c(2, 3) ),ncol =1,rel_heights =c(0.05, 1))