img_coords <- tribble(
  ~description,                    ~x,    ~y,   ~curve_group,
  "1805 - Ankle High start",       1484,  886,  "a",
  "1834 - Ankle High end",         1620,  886,  "a",
  "1835 - Floor Length start",     1644,  1015, "a",
  "18something - Floor Length end",1730,  1015, "a",
  "18something - Ankle high start",1751,  886,  "a",
  "18something - Ankle high end",  1761,  886,  "a",
  "18something - Floor length start", 1794, 1015, "a",
  "18something - Floor length end",1880,  1015, "a",
  "18something - Ankle high start",1904,  886,  "a",
  "18something - Ankle high",      1914,  886,  "a",
  "18something - Floor length",    1937,  1015, "a",
  "18something - Floor length",    2014,  1015, "a",
  "1910 - Floor length",           2014,  1015, "post 1910",
  "1910s - Above Floor length",    2056,  788,  "post 1910",
  "Next",                          2099,  853,  "post 1910",
  "1927 - Knee length",            2158,  630,  "post 1910",
  "Next",                          2210,  800,  "post 1910",
  "Next",                          2248,  680,  "post 1910",
  "Next",                          2283,  801,  "post 1910",
  "Next",                          2313,  680,  "post 1910",
  "Next",                          2350,  800,  "post 1910",
  "1970",                          2394,  552,  "post 1910",
  "post 70s bottom start",         2394,  552,  "post 70s",
  "post 70s bottom end",           2527,  552,  "post 70s",
  "post 70s height start",         2394,  892,  "post 70s",
  "post 70s height end",           2527,  892,  "post 70s"
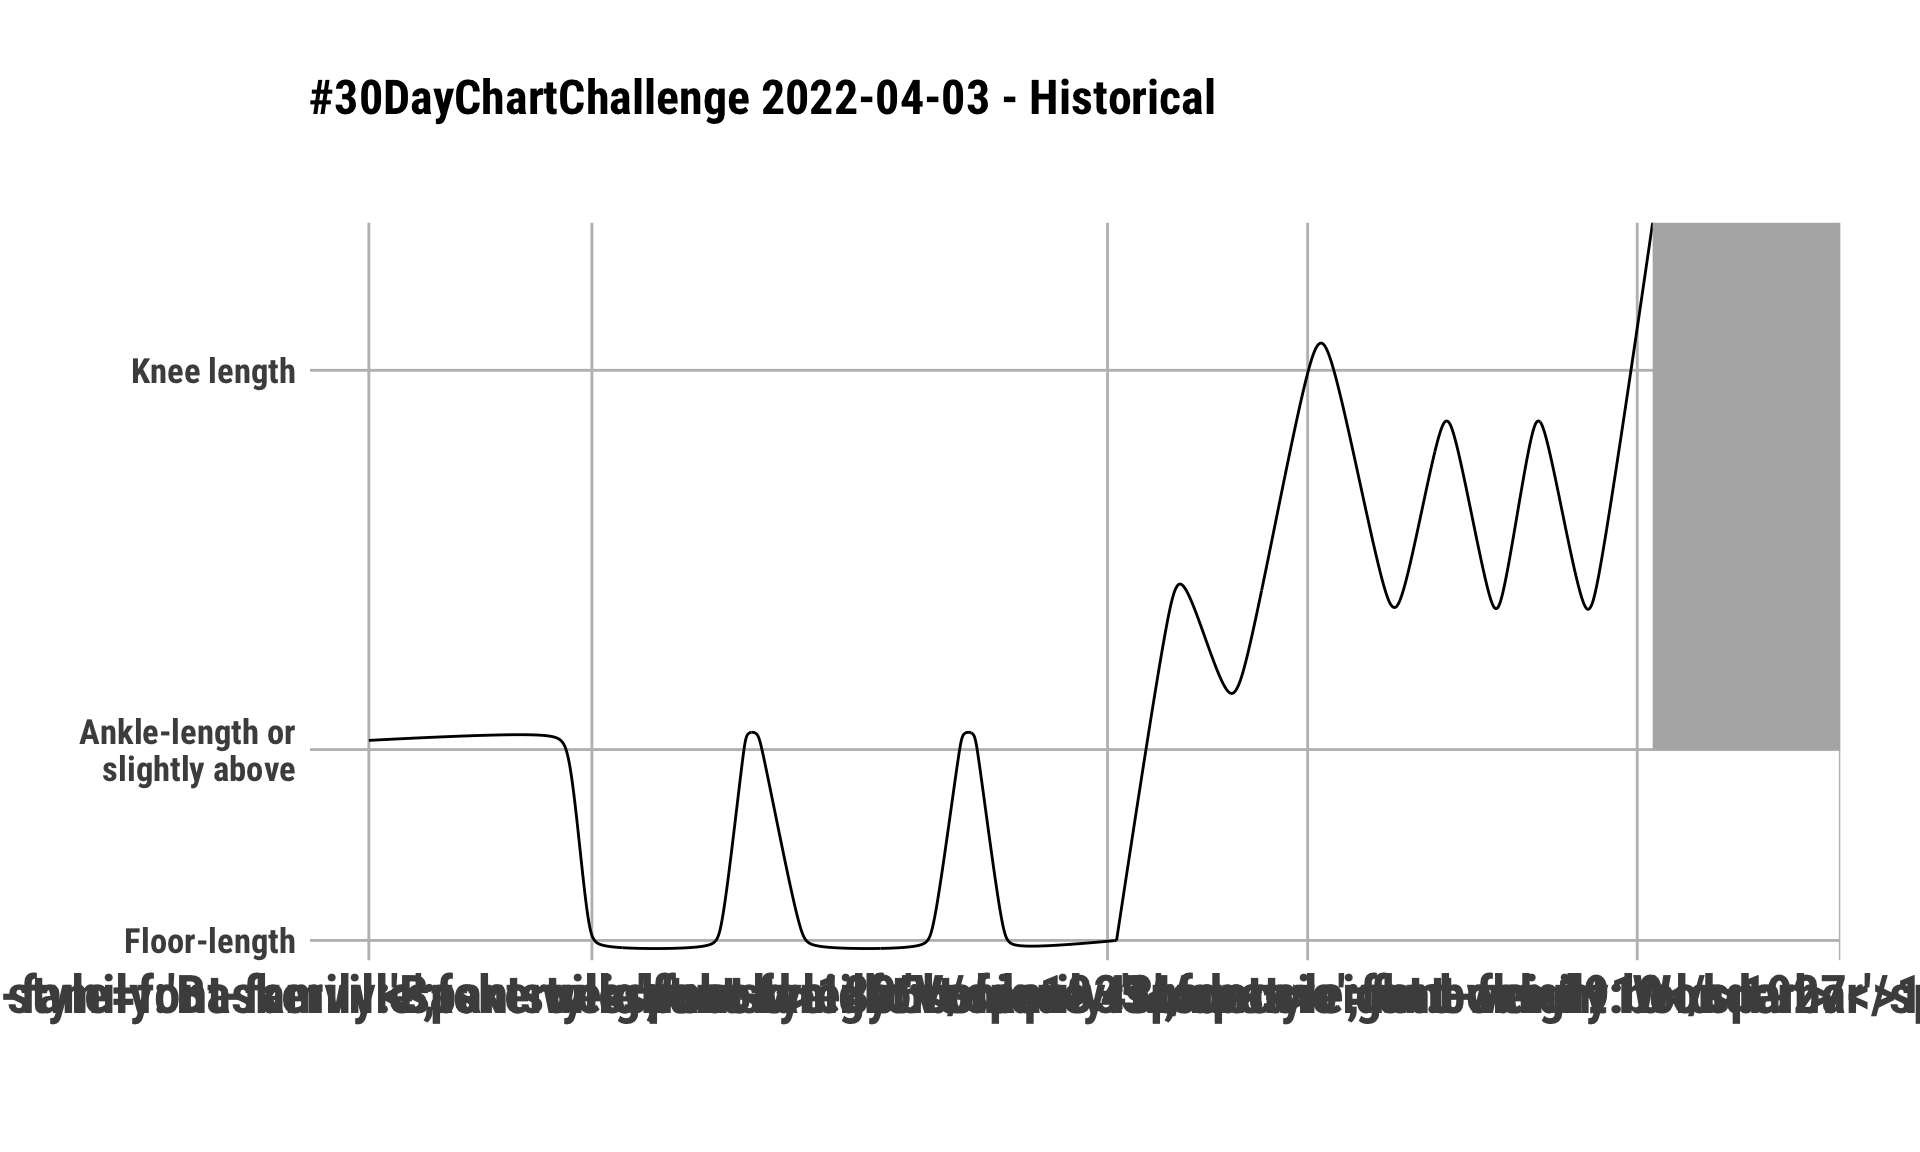
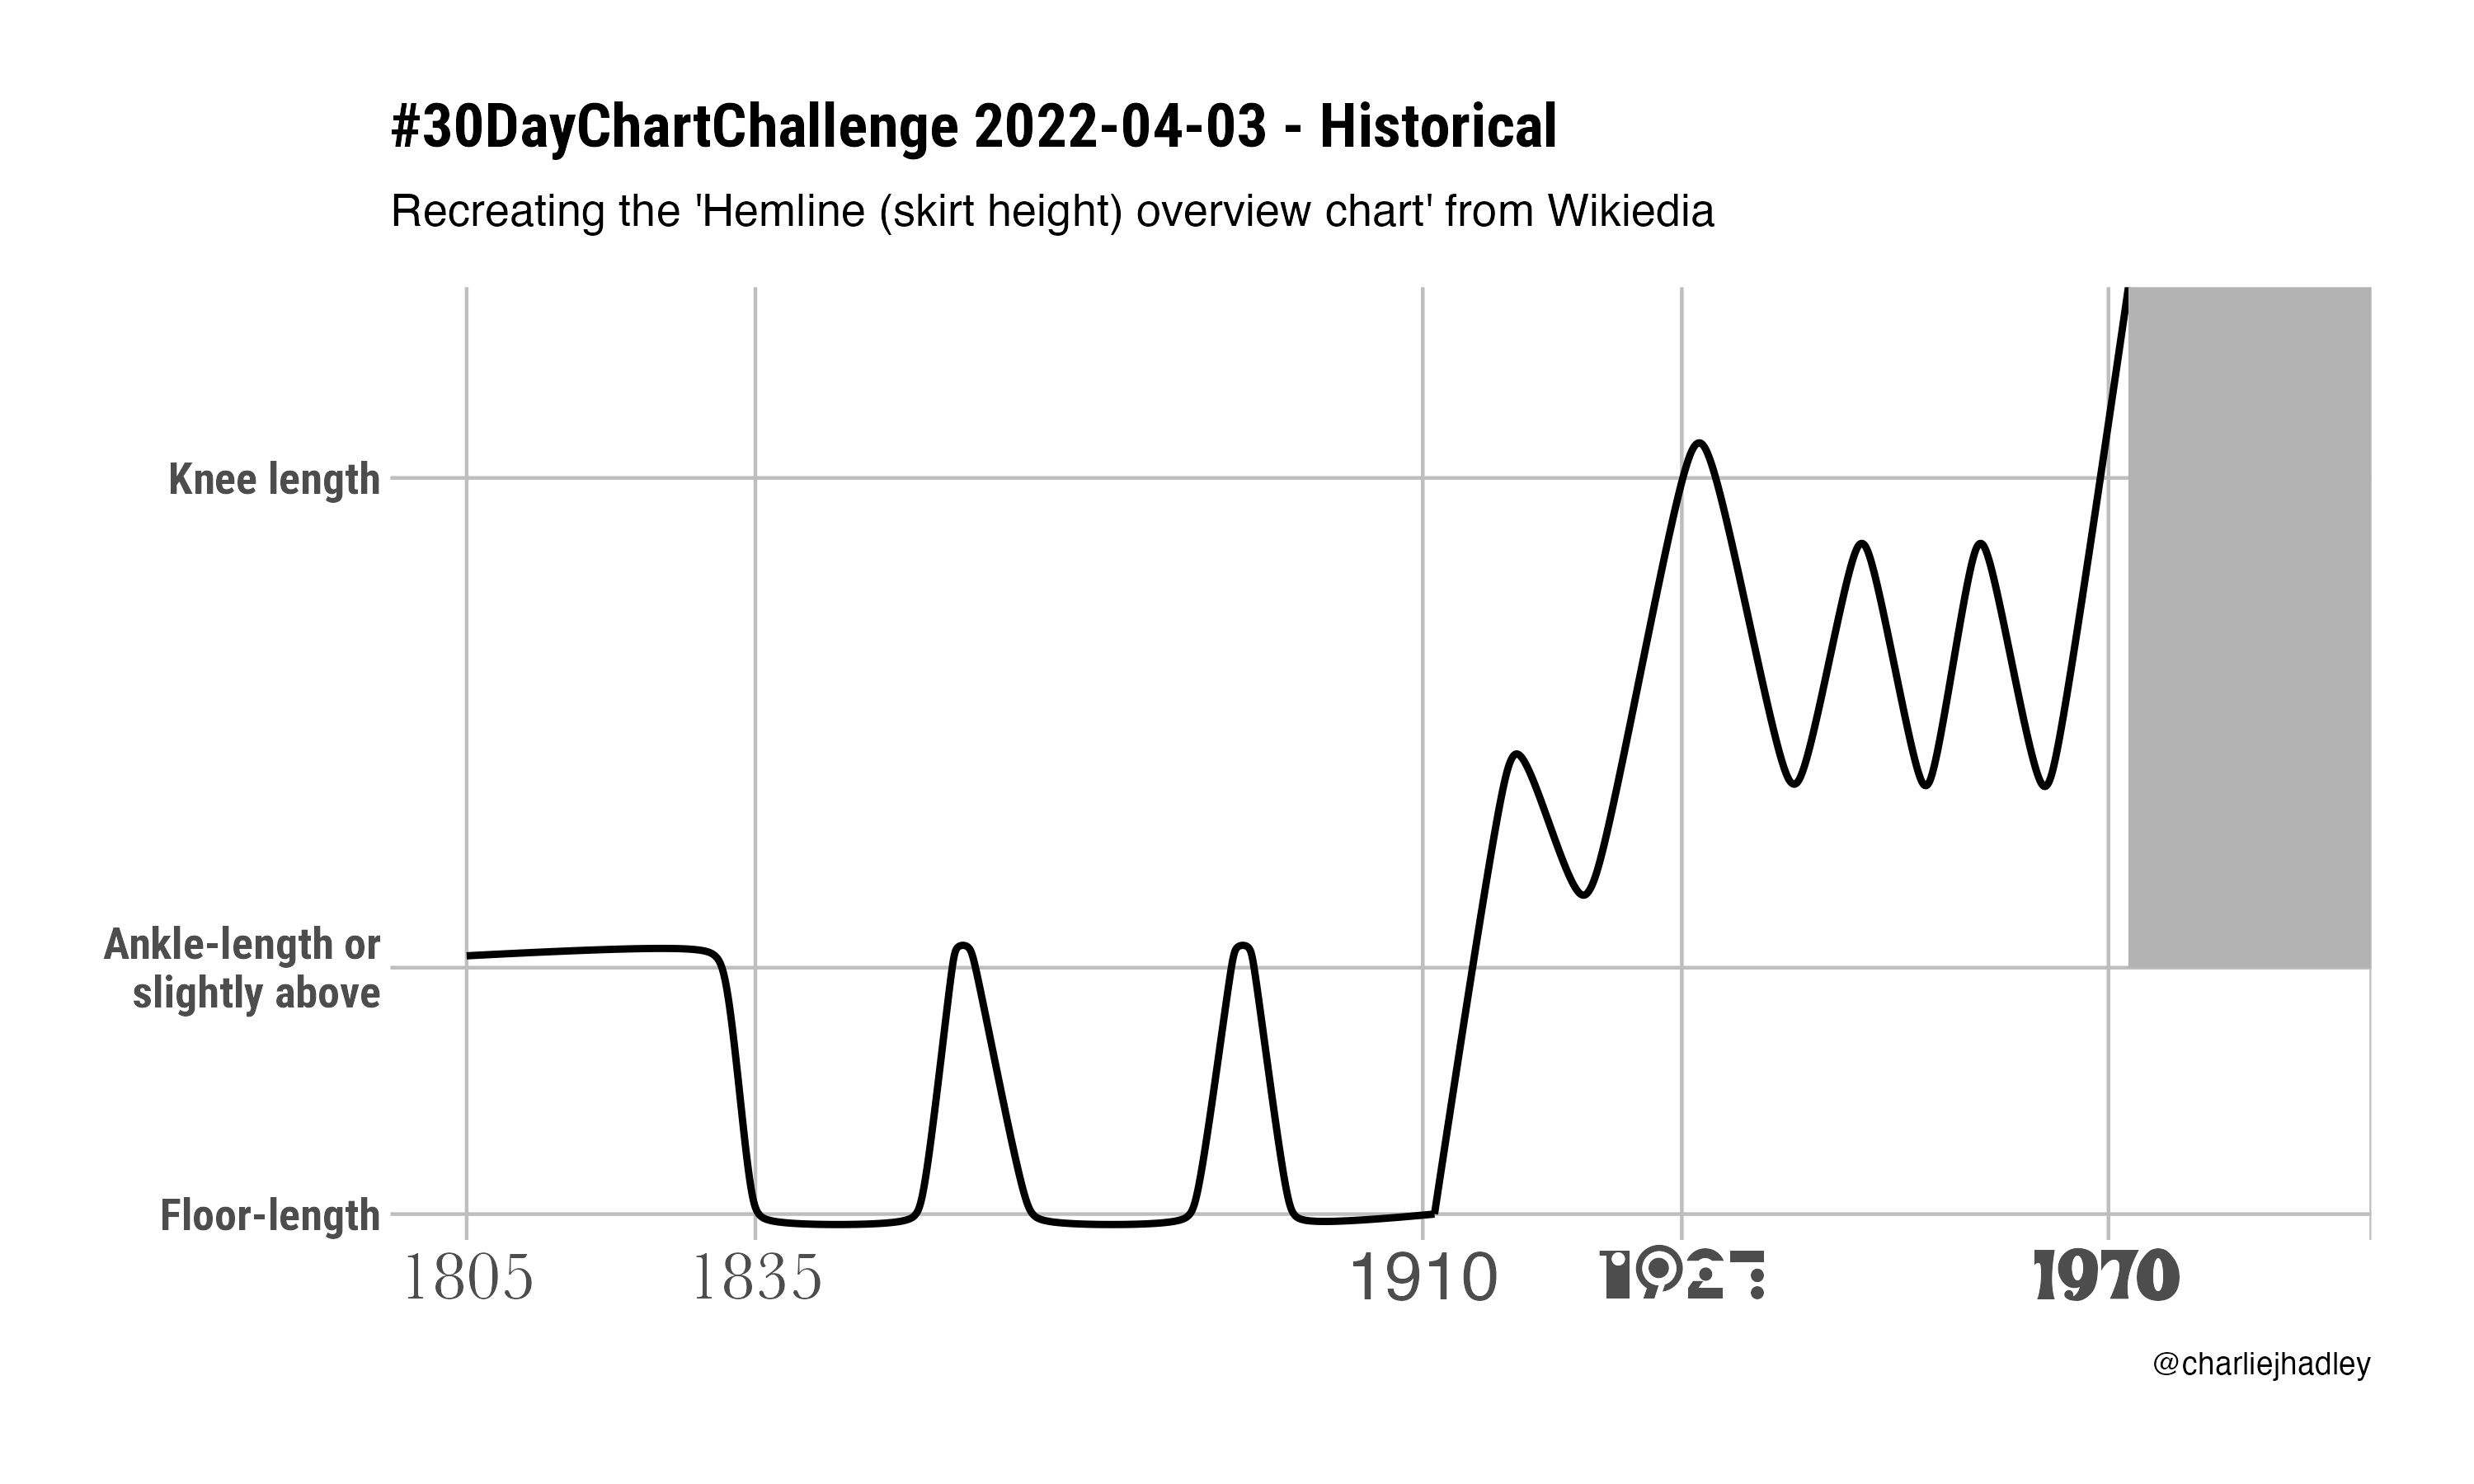
)Today’s prompt is Historical. I recreated the hemline (skirt height) overview chart from Wikipedia by digitising coordinates directly from the image.
Digitised coordinates
The x/y values were read off the original Wikipedia image in pixel space:
Rescaling to chart space
chart_lims <- list(
  ymin = max(img_coords$y),
  ymax = min(img_coords$y),
  xmin = min(img_coords$x),
  xmax = max(img_coords$x)
)

img_coords_rescaled <- img_coords |>
  mutate(
    x_rescaled = rescale(x, c(0, 500), c(chart_lims$xmin, chart_lims$xmax)),
    y_rescaled = rescale(y, c(0, 1200), c(chart_lims$ymin, chart_lims$ymax))
  )

post_70s_ribbon <- img_coords_rescaled |>
  filter(curve_group == "post 70s") |>
  mutate(curve_position = case_when(
    str_detect(description, "height") ~ "top",
    str_detect(description, "bottom") ~ "bottom"
  )) |>
  select(curve_position, contains("rescaled")) |>
  pivot_wider(names_from = curve_position, values_from = y_rescaled) |>
  mutate(y_rescaled = bottom) |>
  arrange(x_rescaled)
Chart
img_coords_rescaled |>
  ggplot(aes(x = x_rescaled, y = y_rescaled)) +
  geom_xspline(
    data = filter(img_coords_rescaled, curve_group == "post 1910"),
    spline_shape = -0.3, linewidth = 1
  ) +
  geom_xspline(
    data = filter(img_coords_rescaled, curve_group == "a"),
    spline_shape = -0.2, linewidth = 1
  ) +
  geom_ribbon(
    data = post_70s_ribbon,
    aes(ymin = bottom, ymax = top, x = x_rescaled),
    fill = "gray70"
  ) +
  scale_x_continuous(
    breaks = c(0, 75.8, 251, 319, 431, 500),
    labels = c(
      "<span style=font-family:'Baskerville';font-weight:bold>1805</span>",
      "<span style=font-family:'Baskerville';font-weight:bold>1835</span>",
      "<span style=font-family:'Vonique 43';font-weight:bold>1910</span>",
      "<span style=font-family:'Modeccio';font-weight:bold>1927</span>",
      "<span style=font-family:'Wonderbar'>1970</span>",
      ""
    ),
    expand = expansion(add = c(20, 0))
  ) +
  scale_y_continuous(
    breaks = c(0, 319, 953),
    labels = c("Floor-length", "Ankle-length or\n slightly above", "Knee length"),
    expand = expansion(add = c(20, 0))
  ) +
  labs(
    x        = NULL,
    y        = NULL,
    title    = "#30DayChartChallenge 2022-04-03 - Historical",
    subtitle = "Recreating the 'Hemline (skirt height) overview chart' from Wikipedia",
    caption  = "@charliejhadley"
  ) +
  theme_ipsum_rc(base_family = "Roboto Condensed") +
  theme(
    plot.title    = element_text(hjust = 0, size = 18, margin = margin(b = 10),
                                 family = "Roboto Condensed", face = "bold"),
    plot.subtitle = element_text(hjust = 0, size = 13, margin = margin(b = 15)),
    axis.text.y   = element_text(size = 13, family = "Roboto Condensed"),
    axis.text.x   = element_markdown(size = 20),
    panel.grid.minor = element_blank(),
    panel.grid.major = element_line(color = "grey", linewidth = 0.5)
  )
Warning in geom_xspline(data = filter(img_coords_rescaled, curve_group == :
Ignoring unknown parameters: `linewidth`Warning in geom_xspline(data = filter(img_coords_rescaled, curve_group == :
Ignoring unknown parameters: `linewidth`Warning: Using the `size` aesthetic in this geom was deprecated in ggplot2 3.4.0.
ℹ Please use `linewidth` in the `default_aes` field and elsewhere instead.Warning in grid.Call(C_stringMetric, as.graphicsAnnot(x$label)): no font could
be found for family "Roboto Condensed Light"
Warning in grid.Call(C_stringMetric, as.graphicsAnnot(x$label)): no font could
be found for family "Roboto Condensed Light"
Warning in grid.Call(C_stringMetric, as.graphicsAnnot(x$label)): no font could
be found for family "Roboto Condensed Light"
Warning in grid.Call(C_stringMetric, as.graphicsAnnot(x$label)): no font could
be found for family "Roboto Condensed Light"
Warning in grid.Call(C_stringMetric, as.graphicsAnnot(x$label)): no font could
be found for family "Roboto Condensed Light"
Warning in grid.Call(C_stringMetric, as.graphicsAnnot(x$label)): no font could
be found for family "Roboto Condensed Light"
Warning in grid.Call(C_stringMetric, as.graphicsAnnot(x$label)): no font could
be found for family "Roboto Condensed Light"
Warning in grid.Call(C_stringMetric, as.graphicsAnnot(x$label)): no font could
be found for family "Roboto Condensed Light"
Warning in grid.Call(C_stringMetric, as.graphicsAnnot(x$label)): no font could
be found for family "Roboto Condensed Light"
Warning in grid.Call(C_stringMetric, as.graphicsAnnot(x$label)): no font could
be found for family "Roboto Condensed Light"
Warning in grid.Call(C_stringMetric, as.graphicsAnnot(x$label)): no font could
be found for family "Roboto Condensed Light"
Warning in grid.Call(C_stringMetric, as.graphicsAnnot(x$label)): no font could
be found for family "Roboto Condensed Light"
Warning in grid.Call(C_stringMetric, as.graphicsAnnot(x$label)): no font could
be found for family "Roboto Condensed Light"
Warning in grid.Call(C_stringMetric, as.graphicsAnnot(x$label)): no font could
be found for family "Roboto Condensed Light"
Warning in grid.Call(C_stringMetric, as.graphicsAnnot(x$label)): no font could
be found for family "Roboto Condensed Light"
Warning in grid.Call(C_stringMetric, as.graphicsAnnot(x$label)): no font could
be found for family "Roboto Condensed Light"
Warning in grid.Call(C_stringMetric, as.graphicsAnnot(x$label)): no font could
be found for family "Roboto Condensed Light"
Warning in grid.Call(C_stringMetric, as.graphicsAnnot(x$label)): no font could
be found for family "Roboto Condensed Light"
Warning in grid.Call(C_stringMetric, as.graphicsAnnot(x$label)): no font could
be found for family "Roboto Condensed Light"
Warning in grid.Call(C_stringMetric, as.graphicsAnnot(x$label)): no font could
be found for family "Roboto Condensed Light"
Warning in grid.Call(C_stringMetric, as.graphicsAnnot(x$label)): no font could
be found for family "Roboto Condensed Light"
Warning in grid.Call(C_stringMetric, as.graphicsAnnot(x$label)): no font could
be found for family "Roboto Condensed Light"
Warning in grid.Call(C_stringMetric, as.graphicsAnnot(x$label)): no font could
be found for family "Roboto Condensed Light"
Warning in grid.Call(C_stringMetric, as.graphicsAnnot(x$label)): no font could
be found for family "Roboto Condensed Light"
Warning in grid.Call(C_stringMetric, as.graphicsAnnot(x$label)): no font could
be found for family "Roboto Condensed Light"
Warning in grid.Call(C_stringMetric, as.graphicsAnnot(x$label)): no font could
be found for family "Roboto Condensed Light"
Warning in grid.Call(C_stringMetric, as.graphicsAnnot(x$label)): no font could
be found for family "Roboto Condensed Light"
Warning in grid.Call(C_stringMetric, as.graphicsAnnot(x$label)): no font could
be found for family "Roboto Condensed Light"Warning in grid.Call(C_textBounds, as.graphicsAnnot(x$label), x$x, x$y, : no
font could be found for family "Roboto Condensed Light"
Warning in grid.Call(C_textBounds, as.graphicsAnnot(x$label), x$x, x$y, : no
font could be found for family "Roboto Condensed Light"
Warning in grid.Call(C_textBounds, as.graphicsAnnot(x$label), x$x, x$y, : no
font could be found for family "Roboto Condensed Light"
Warning in grid.Call(C_textBounds, as.graphicsAnnot(x$label), x$x, x$y, : no
font could be found for family "Roboto Condensed Light"Warning in grid.Call.graphics(C_text, as.graphicsAnnot(x$label), x$x, x$y, : no
font could be found for family "Roboto Condensed Light"
Warning in grid.Call.graphics(C_text, as.graphicsAnnot(x$label), x$x, x$y, : no
font could be found for family "Roboto Condensed Light"
Warning in grid.Call.graphics(C_text, as.graphicsAnnot(x$label), x$x, x$y, : no
font could be found for family "Roboto Condensed Light"
Warning in grid.Call.graphics(C_text, as.graphicsAnnot(x$label), x$x, x$y, : no
font could be found for family "Roboto Condensed Light"
Warning in grid.Call.graphics(C_text, as.graphicsAnnot(x$label), x$x, x$y, : no
font could be found for family "Roboto Condensed Light"
Warning in grid.Call.graphics(C_text, as.graphicsAnnot(x$label), x$x, x$y, : no
font could be found for family "Roboto Condensed Light"