pch_tib <- tibble(
  pch_number = 0:25,
  pch_description = c(rep("Outline", 15), rep("Fill", 6), rep("Both", 5))
) |>
  mutate(
    pch_description = as_factor(pch_description),
    pch_description = fct_relevel(pch_description, c("Outline", "Fill", "Both"))
  )

pch_outline <- pch_tib |>
  filter(pch_description == "Outline") |>
  mutate(x = rep(1:5, 3), y = rev(sort(rep(c("a", "b", "c"), 5))))

pch_fill <- pch_tib |>
  filter(pch_description == "Fill") |>
  mutate(x = 1:6, y = rep("d", 6))

pch_both <- pch_tib |>
  filter(pch_description == "Both") |>
mutate(x = 1:5, y = rep("e", 5))When using geom_point() in {ggplot2} you can control the shape of each point with the shape (or pch) aesthetic. But which numbers give you which shapes — and crucially, which respond to color vs fill?
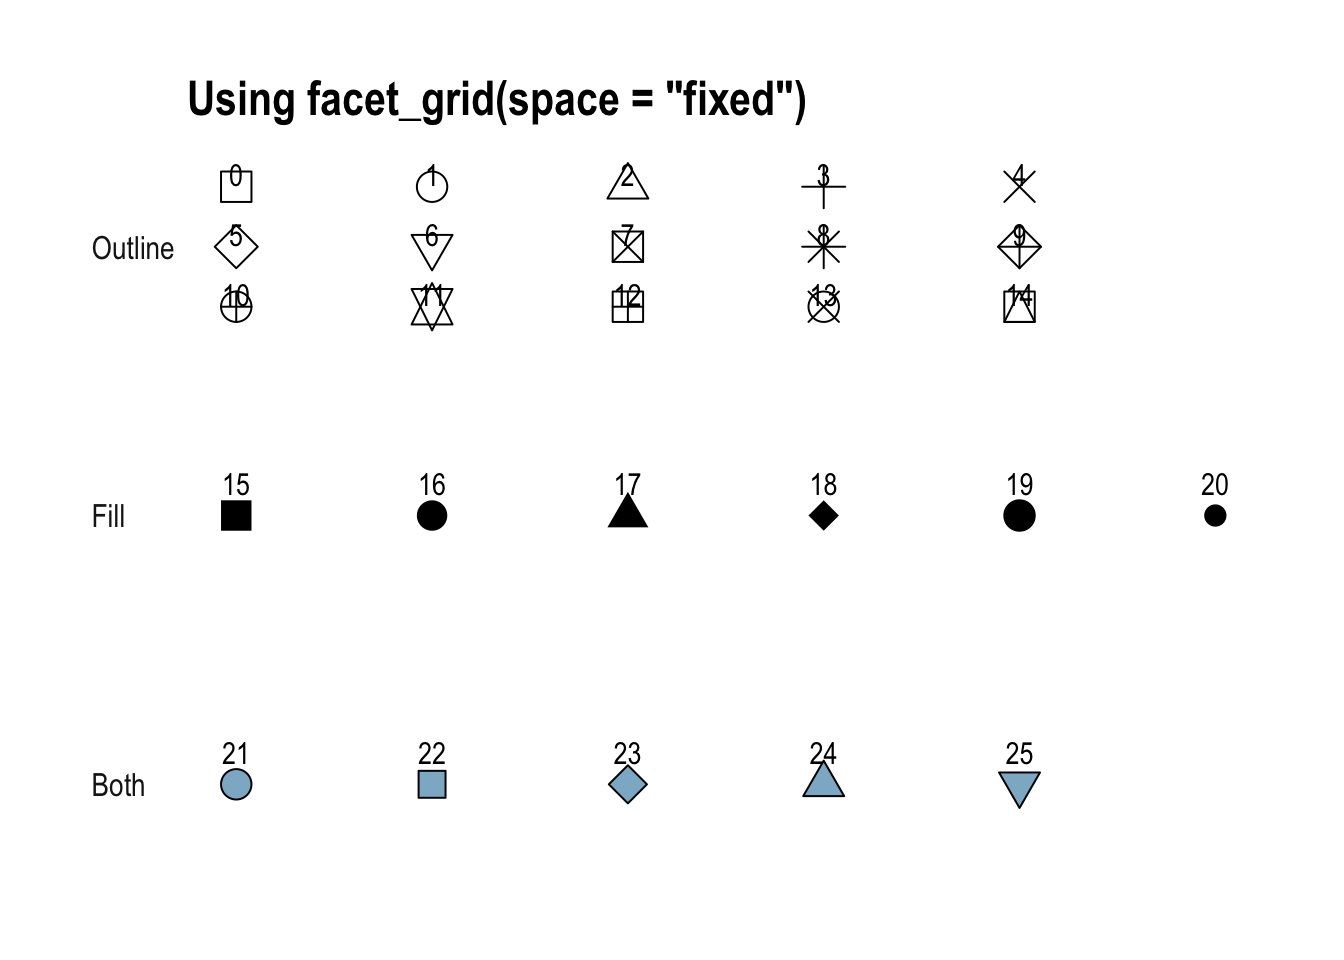
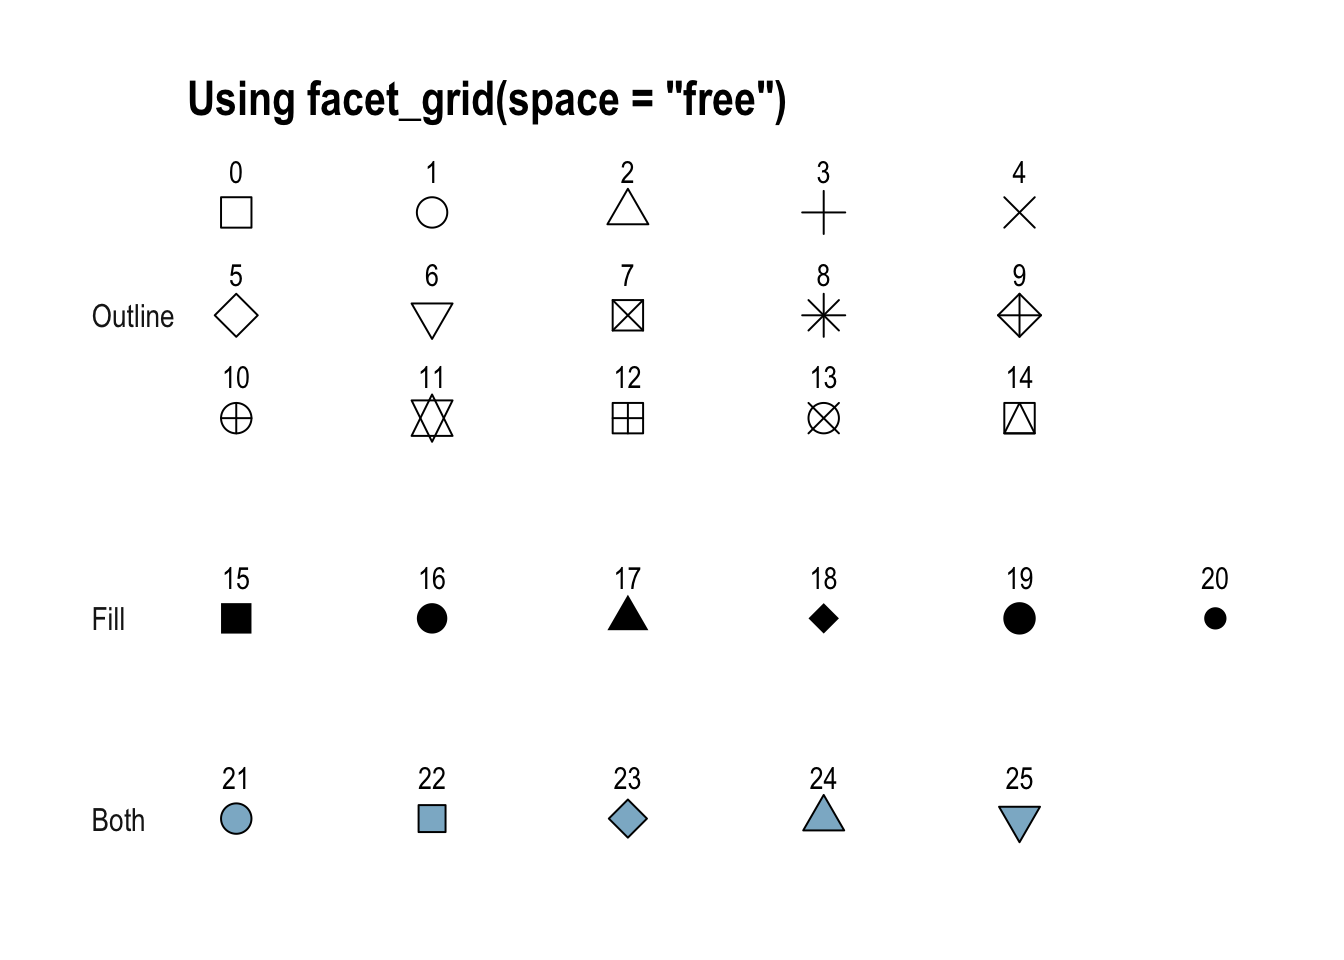
There are 26 shapes (0–25), split into three groups:
- Outline (0–14): only the
coloraesthetic applies. - Fill (15–20): only the
coloraesthetic applies (the shape is solid). - Both (21–25):
colorcontrols the border andfillcontrols the interior.
Fixed vs free facet spacing
The charts below use facet_grid() to group the shapes by type. The space argument controls how the panel heights relate to each other.
space = “fixed”
With space = "fixed" each row of the grid takes up equal height regardless of how many points it contains.
pch_outline |>
  bind_rows(pch_fill, pch_both) |>
  ggplot(aes(x = x, y = y, pch = pch_number)) +
  geom_point(fill = "lightskyblue3", color = "black", size = 5) +
  geom_text(aes(label = pch_number), nudge_y = 0.2) +
  facet_grid(
    pch_description ~ .,
    scales = "free_y",
    switch = "y",
    space = "fixed"
  ) +
  scale_shape_identity() +
  labs(title = 'Using facet_grid(space = "fixed")') +
  theme_ipsum() +
  theme(
    strip.text.y.left = element_text(angle = 0),
    panel.grid.major = element_blank(),
    panel.grid.minor = element_blank(),
    axis.text.y = element_blank(),
    axis.text.x = element_blank(),
    axis.title.x = element_blank(),
    axis.title.y = element_blank()
  )
space = “free”
With space = "free" each row height is proportional to the number of distinct y values it contains, so groups with fewer shapes get less vertical space.
pch_outline |>
  bind_rows(pch_fill, pch_both) |>
  ggplot(aes(x = x, y = y, pch = pch_number)) +
  geom_point(fill = "lightskyblue3", color = "black", size = 5) +
  geom_text(aes(label = pch_number), nudge_y = 0.4) +
  facet_grid(
    pch_description ~ .,
    scales = "free_y",
    switch = "y",
    space = "free"
  ) +
  scale_shape_identity() +
  labs(title = 'Using facet_grid(space = "free")') +
  theme_ipsum() +
  theme(
    strip.text.y.left = element_text(angle = 0),
    panel.grid.major = element_blank(),
    panel.grid.minor = element_blank(),
    axis.text.y = element_blank(),
    axis.text.x = element_blank(),
    axis.title.x = element_blank(),
    axis.title.y = element_blank()
  )
This chart is a rebuild of the excellent reference at blog.albertkuo.me.