Expertise
Nothing lost in translation
The people who know MARAC data inside out made every decision about what to show and how. There was no consultant to brief, and no fight over whose stakeholder priorities came first: the team already knew.
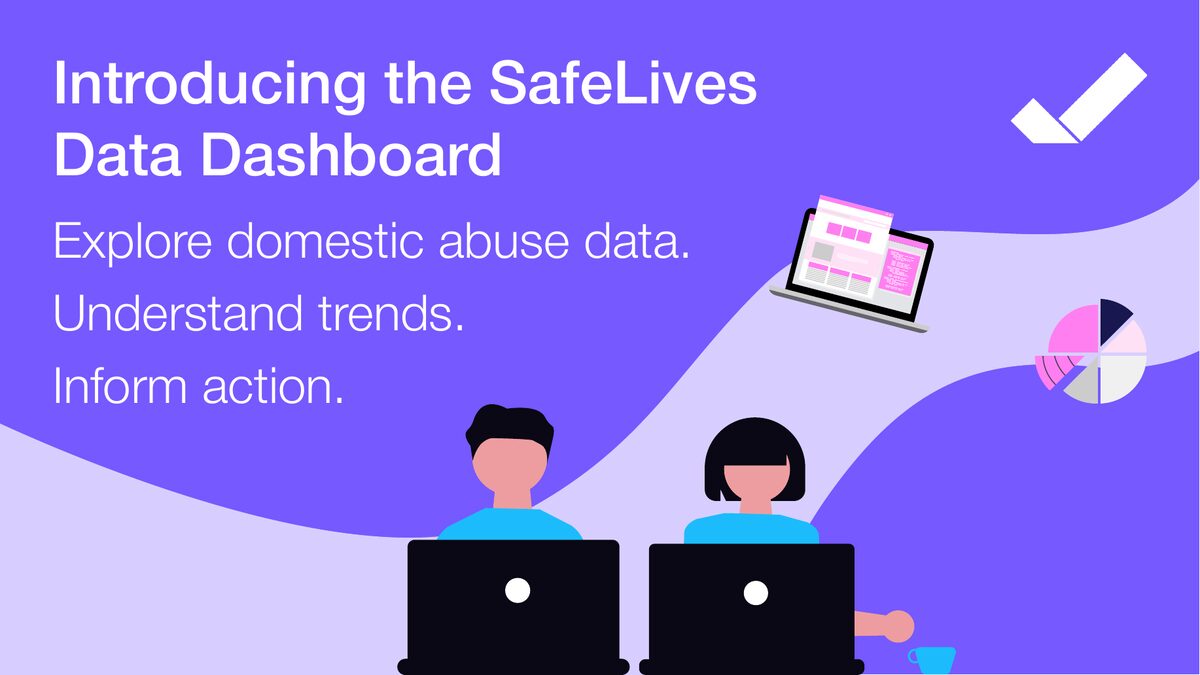
The SafeLives Data Dashboard is a free, open-access Shiny app that brings together UK domestic abuse data for practitioners, commissioners, government and researchers. Their team built every line of it.
The challenge
SafeLives is the UK-wide charity working to end domestic abuse. They hold some of the most important data on it in the country, and they wanted everyone who relies on that data to be able to explore it for themselves.
That meant a large-scale Shiny app serving very different audiences: frontline services, local authorities, commissioners, government policy teams and researchers. Each needed to filter, compare areas and demographics, and download what they found.
The team had the data expertise in spades. What they hadn't really done before was build with Shiny. The obvious route was to hand the whole thing to a consultant. Instead, they chose to build it themselves, with me alongside.
Why coaching, not consulting
Coaching put the build in the hands of the people who understand the data best. That paid off in three ways.
Expertise
The people who know MARAC data inside out made every decision about what to show and how. There was no consultant to brief, and no fight over whose stakeholder priorities came first: the team already knew.
Cost
Outsourcing the build would have cost at least four times as much in development time alone. For a charity, that's money that stays with the work that matters.
Skills
The dashboard is updated quarterly and keeps growing. SafeLives don't need to call anyone in to do it, because the people who built it are still there.
How it worked
When the whole team needed a new skill, from Shiny modules to {highcharter}, they booked a session and we learned it together.
The people building the app brought their real problems. I asked questions, unblocked them and showed them better ways to work.
Twelve days of coaching spread over a year kept momentum up, and gave the team time to practise between sessions.
The result
We started with MARAC data. Once that was in place, the team extended the dashboard to Insights and Local Surveys on their own.
Built with coaching
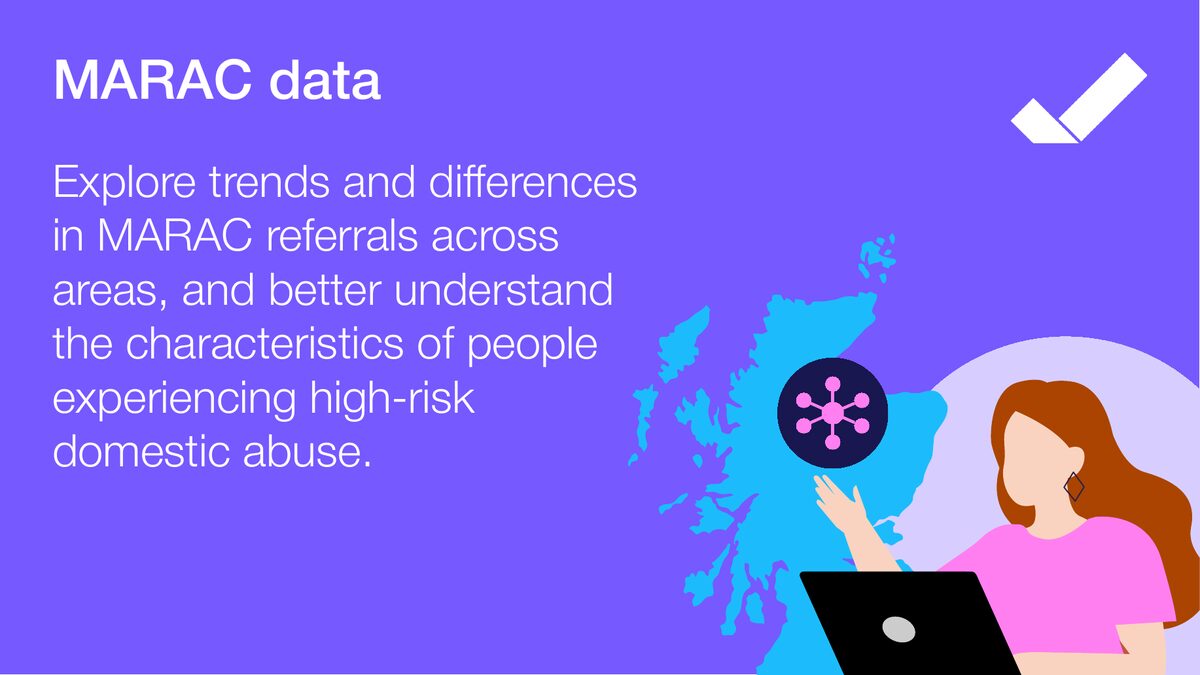
Trends and differences in MARAC referrals across areas, and who is experiencing high-risk domestic abuse. This is where we built the app's foundations together.
Added by the SafeLives team
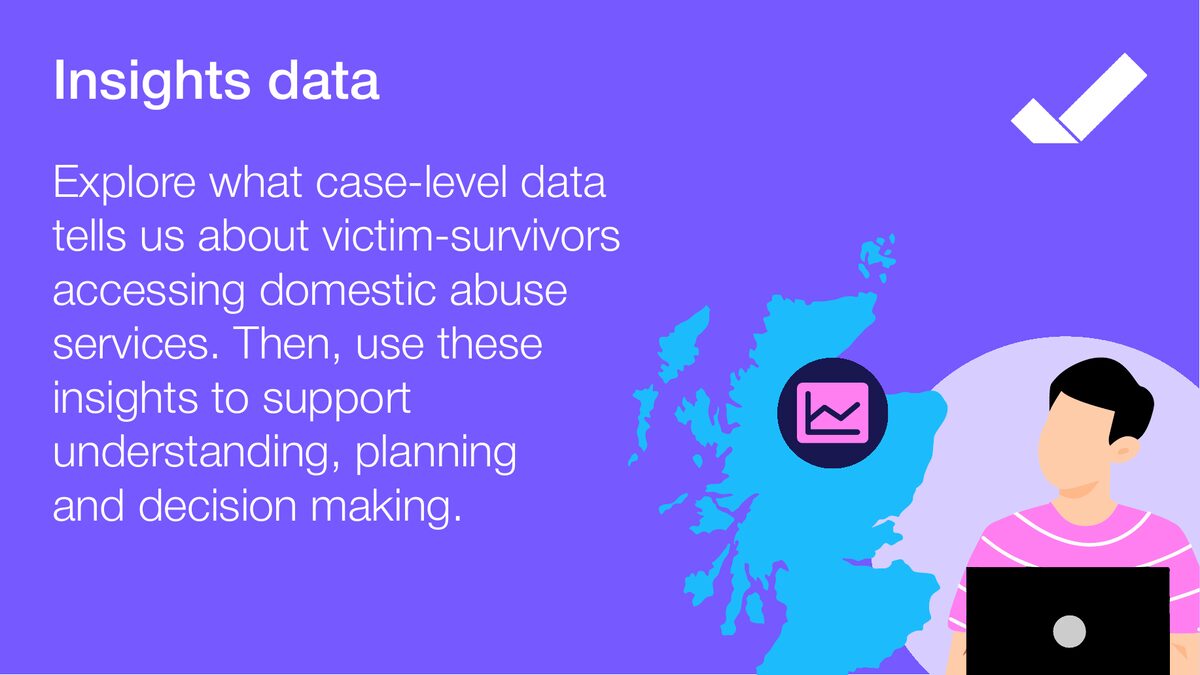
Case-level data about victim-survivors accessing domestic abuse services, to support planning and decision making.
Added by the SafeLives team
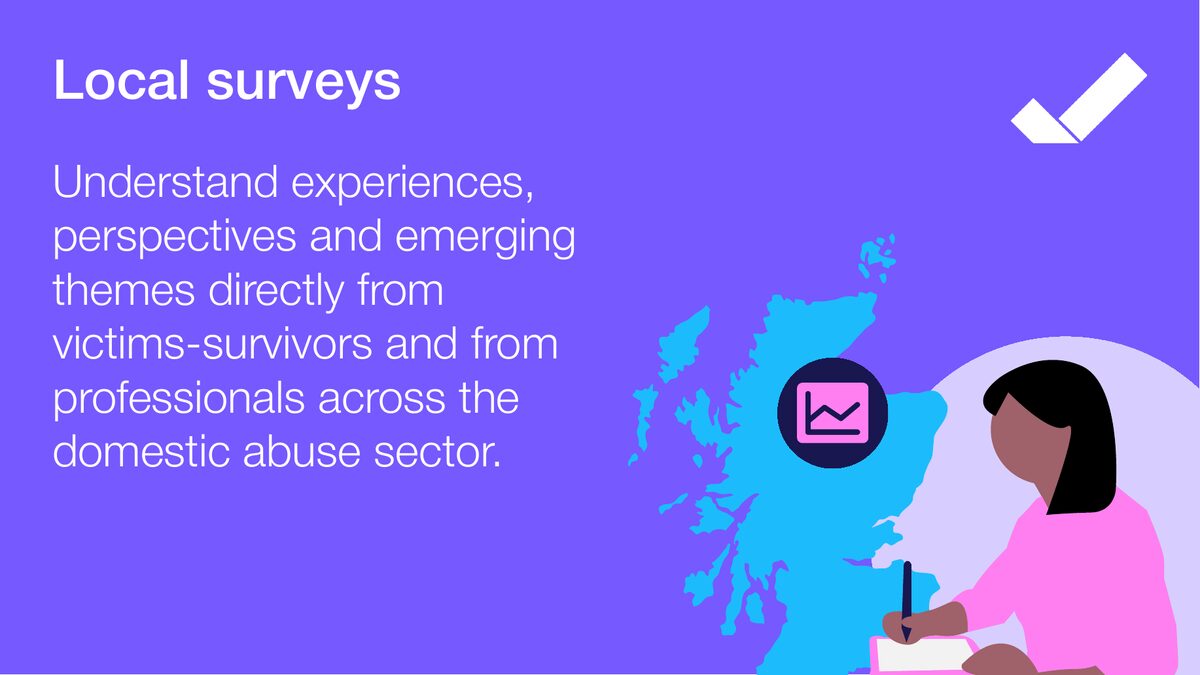
Experiences and emerging themes, straight from victim-survivors and professionals across the domestic abuse sector.
What we worked on
do.call() tricksThe skills didn't stop at the dashboard either. SafeLives now use Quarto and Shiny for interactive reporting elsewhere in their work.
[Testimonial from the SafeLives team, once it arrives]
If your team knows its data and wants to build its own Shiny app, dashboard or reporting, let's talk about coaching.