Charlotte Hadley home Charlotte Hadley home Charlotte Hadley
  • Training
    • All training
    • R training
    • AI & Data Ethics
    • For teams
    • 1:1 coaching
  • Events
  • Talks
  • Portfolio
  • Blog
  • About
  • Get in touch

Portfolio

Portfolio

Things I've made for the love of it

Charts, chart challenges, packages, hex stickers and logos, almost all built in R. Most come with a blog post explaining how.

Pieces

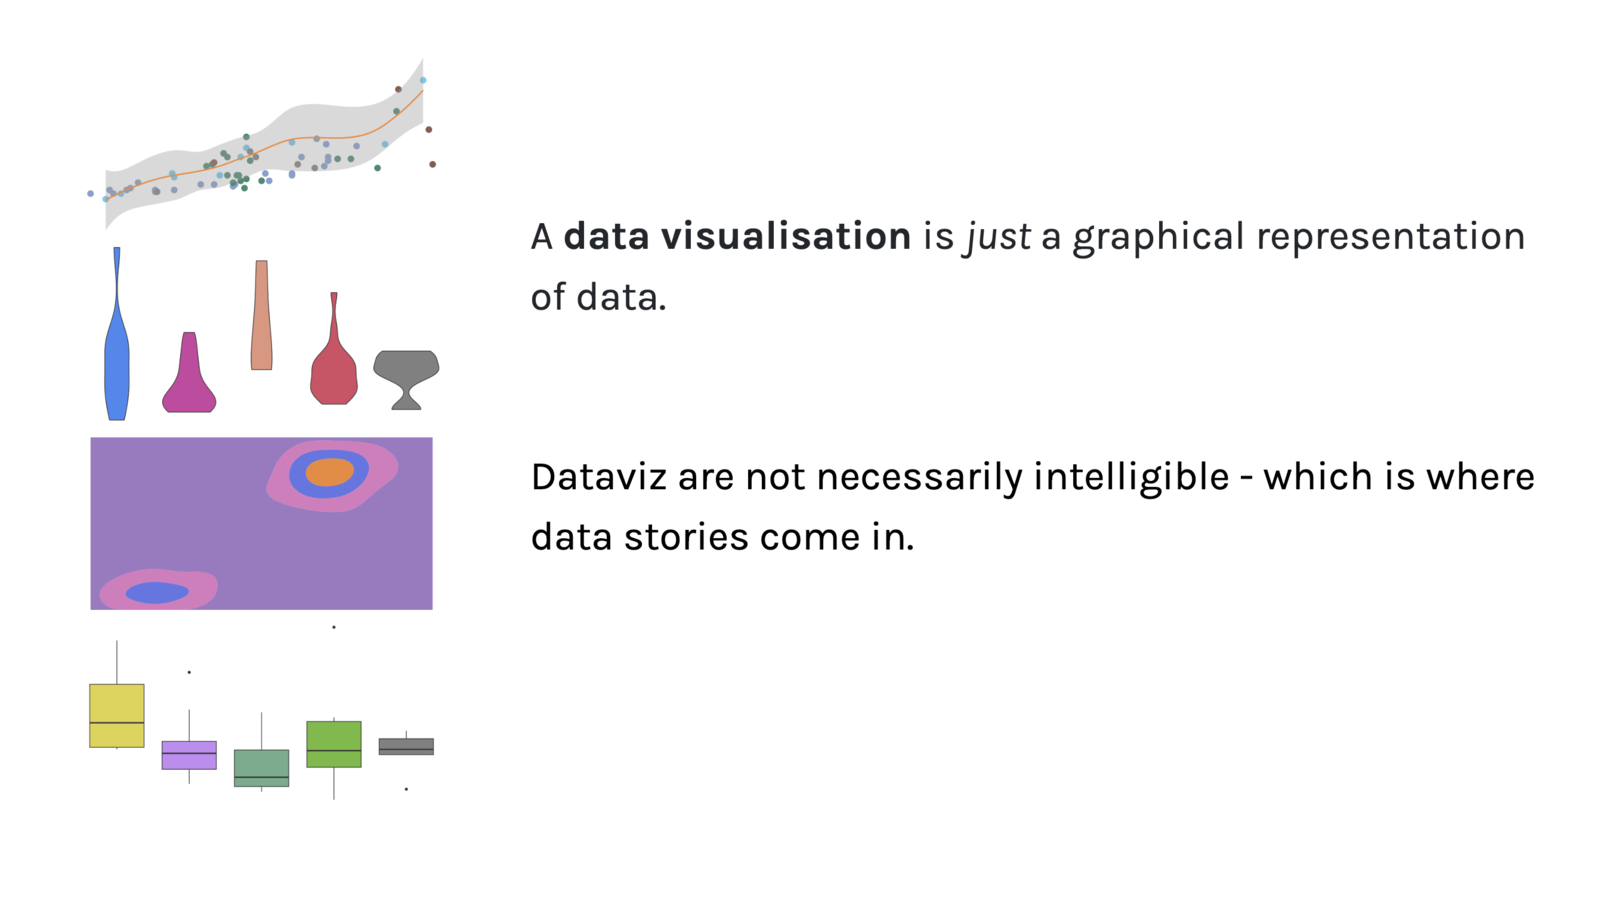
The opening of the story: a scatterplot with a smoothed trend line, a row of vase-shaped violins, a contour plot and a set of box plots, beside text saying that a data visualisation is just a graphical representation of data, and that data stories are what make it intelligible.
  • Data story
  • Honourable mention

You should have a favourite data visualisation

A scrollytelling story built with Quarto's Closeread, about why everyone should have a favourite chart, and how to find yours. An honourable mention in Posit's Closeread Prize.

Read the story: You should have a favourite data visualisation
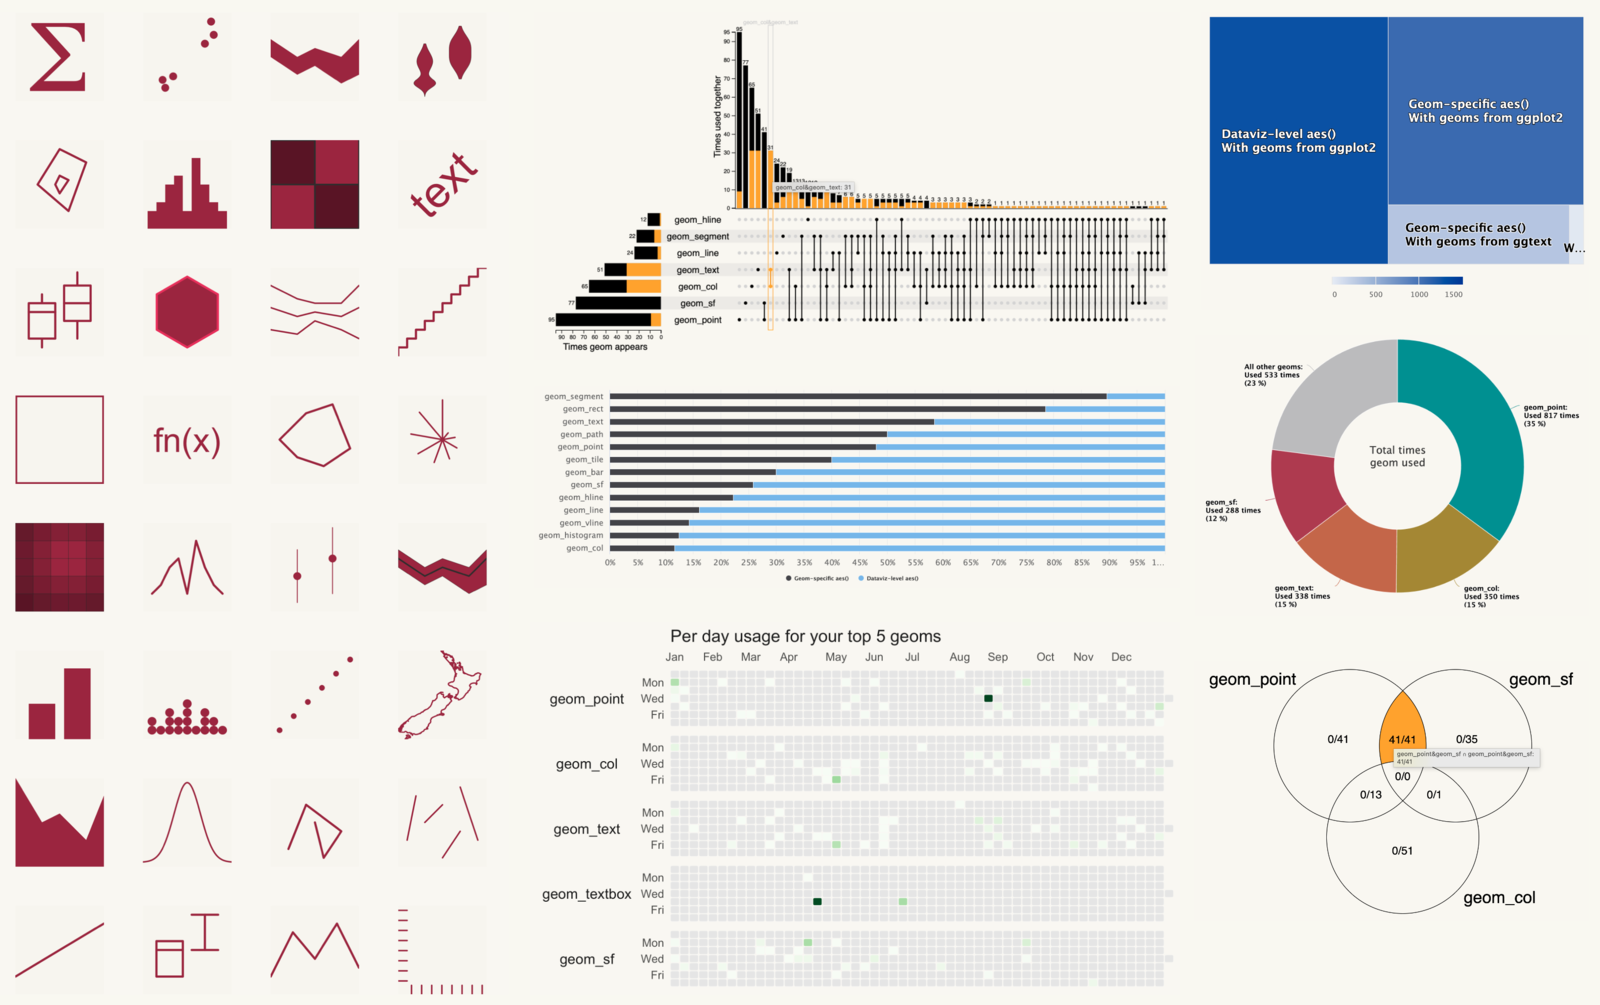
A {ggplot2wrapped} report made of many charts: a grid of icons for each geom used, an UpSet chart of geoms used together, a treemap of aesthetics, a donut chart of total geom use, a long bar chart of geoms, calendar heatmaps of daily use for the top five geoms, and a Venn diagram of geom_point, geom_sf and geom_col.
  • Package

{ggplot2wrapped}

Your year in ggplot2, Spotify Wrapped style, as a shareable report.

Read the post: {ggplot2wrapped}
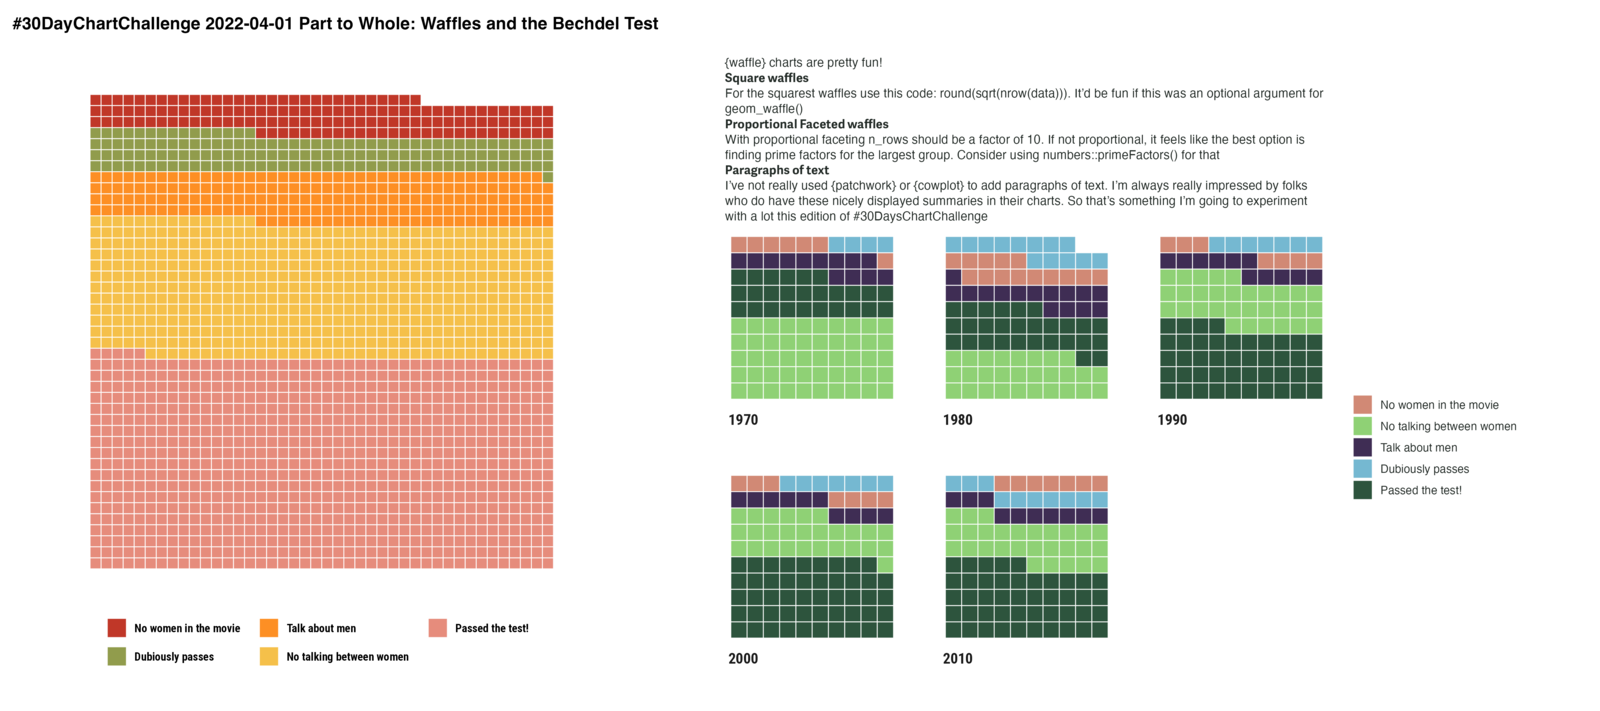
Waffle charts of films and the Bechdel test. One large waffle shows that nearly half of all films pass; the rest have no women, women who never talk to each other, women who only talk about men, or a dubious pass. Five small waffles beside it give the same split for each decade from the 1970s to the 2010s.
  • #30DayChartChallenge

Part to whole: the Bechdel test

Waffle charts of how films fare on the Bechdel test.

Read the post: Part to whole: the Bechdel test
A yellow hexagon sticker. A teal, steam-powered machine labelled JS and R feeds a conveyor belt carrying out a map, a location pin and a widget. The word htmlwidgets runs along the bottom.
  • Design

An htmlwidgets hex sticker

Seven years in the making: a sticker for my favourite R package.

Read the post: An htmlwidgets hex sticker
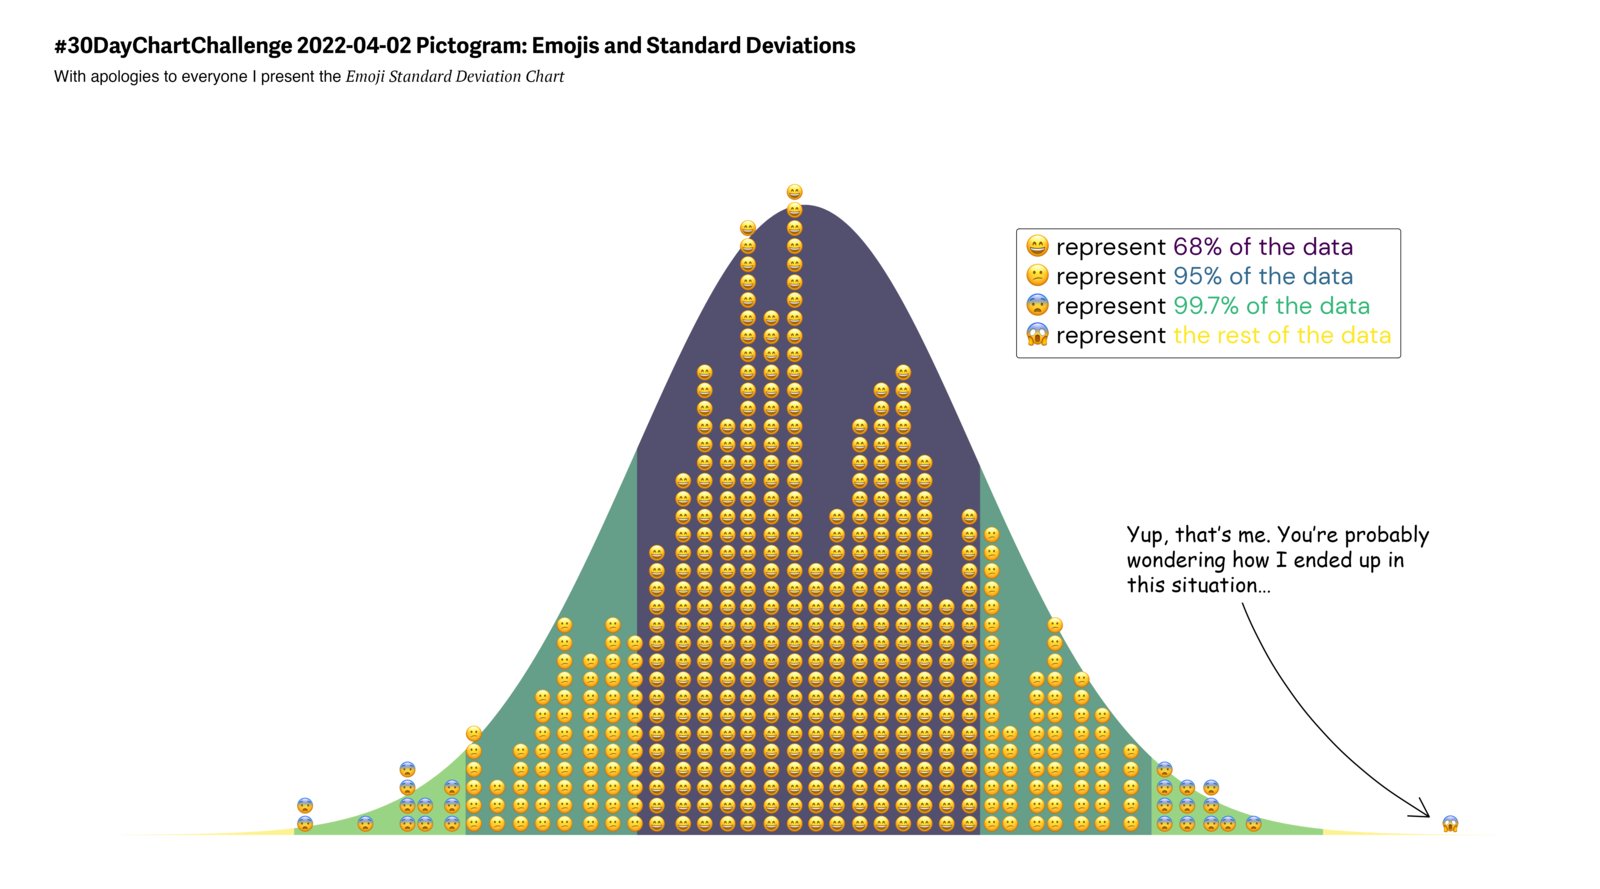
A normal distribution curve filled with stacked emoji faces. Calm faces fill the middle 68% of the data, and the faces get more alarmed towards the tails. A speech bubble from one lonely face far out in the tail reads: Yup, that's me. You're probably wondering how I ended up in this situation.
  • #30DayChartChallenge

Pictogram: emoji histogram

A normal distribution, one emoji at a time.

Read the post: Pictogram: emoji histogram
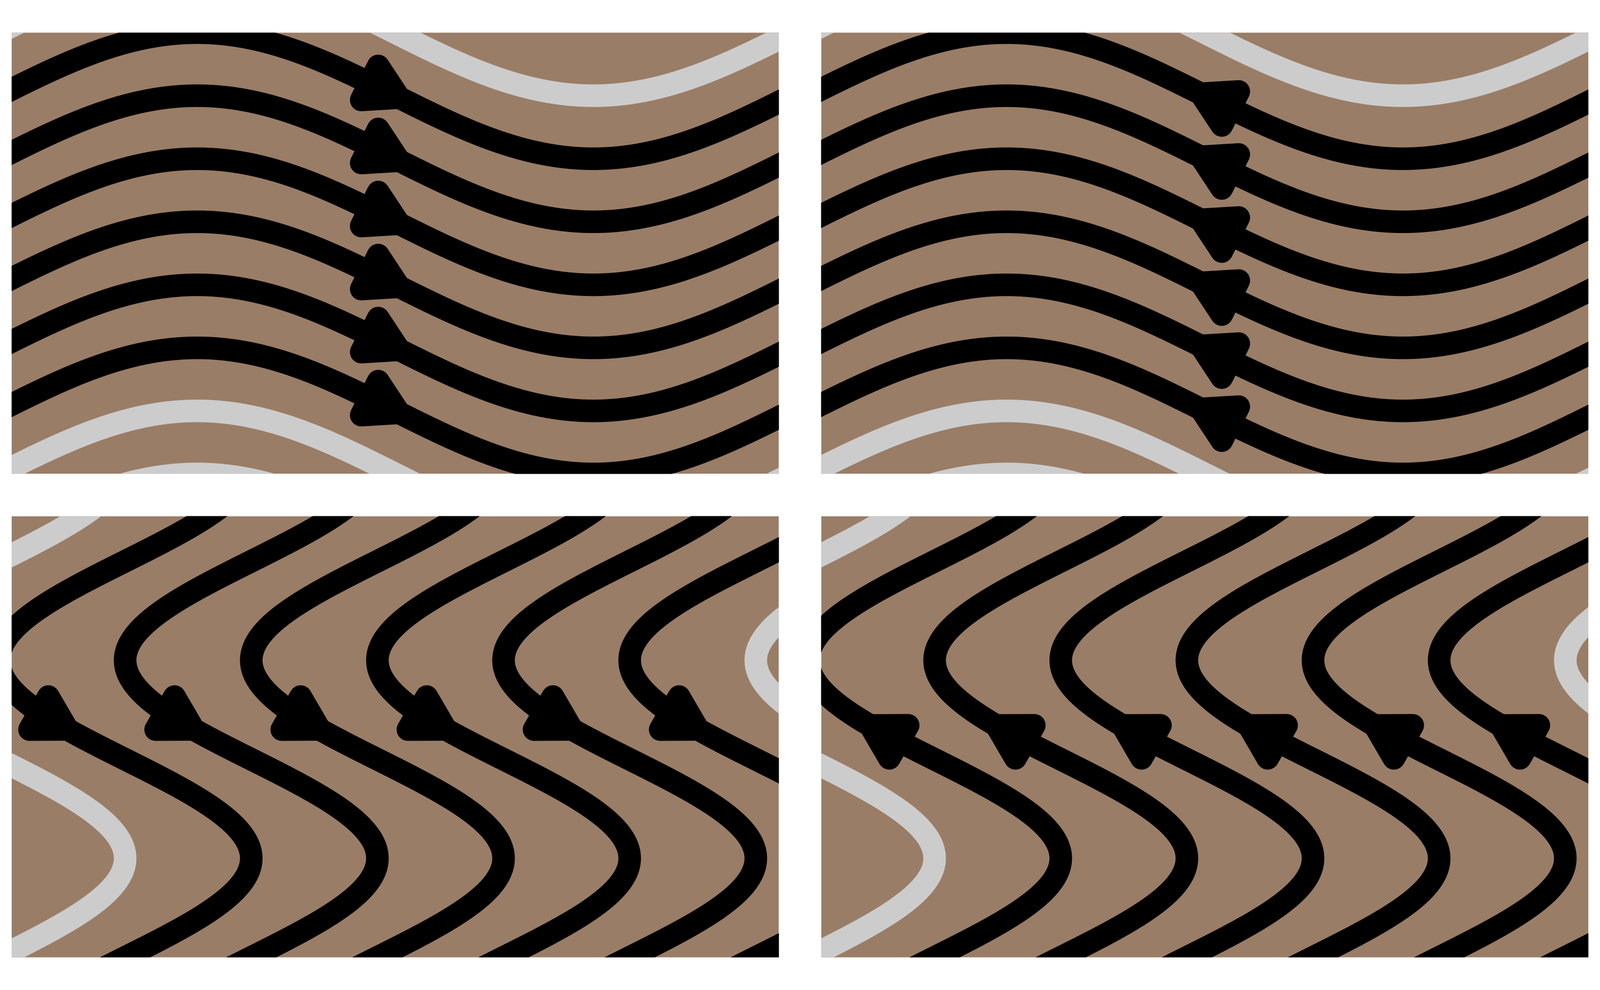
Four tiles of brown stone, each covered in thick black wavy stripes with arrowheads along them. The waves flow in a different direction on each tile, with a pale grey curve running across the corner.
  • Experiment

Curves and stones

Recreating the elemental stones with {ggplot2}.

Read the post: Curves and stones
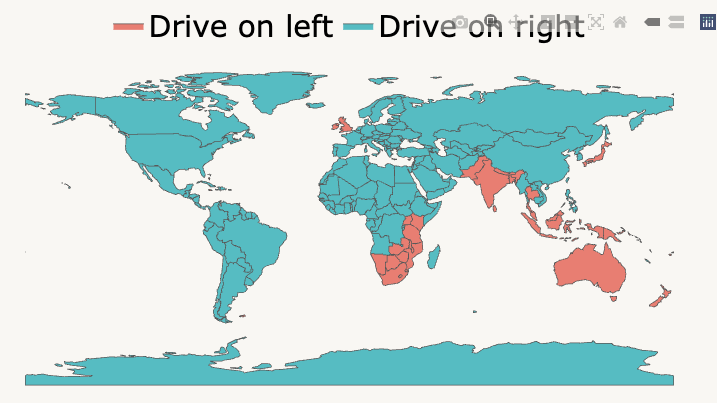
World map coloured by which side of the road traffic drives on. Most of the world drives on the right. The UK, Ireland, India, Japan, much of South-East Asia, Australia, New Zealand and much of southern and eastern Africa drive on the left.
  • Maps

Which side of the road?

A map from a post about why UX and dataviz should talk more.

Read the post: Which side of the road?
The Visible Data logo: a large orange circle with a dark outline, and a smaller gold circle overlapping its top right edge, on a background split diagonally into turquoise, lime green and pink.
  • Design & logos

Logos built with {ggplot2}

The Visible Data mark, drawn entirely in R.

See the brand page: Logos built with {ggplot2}
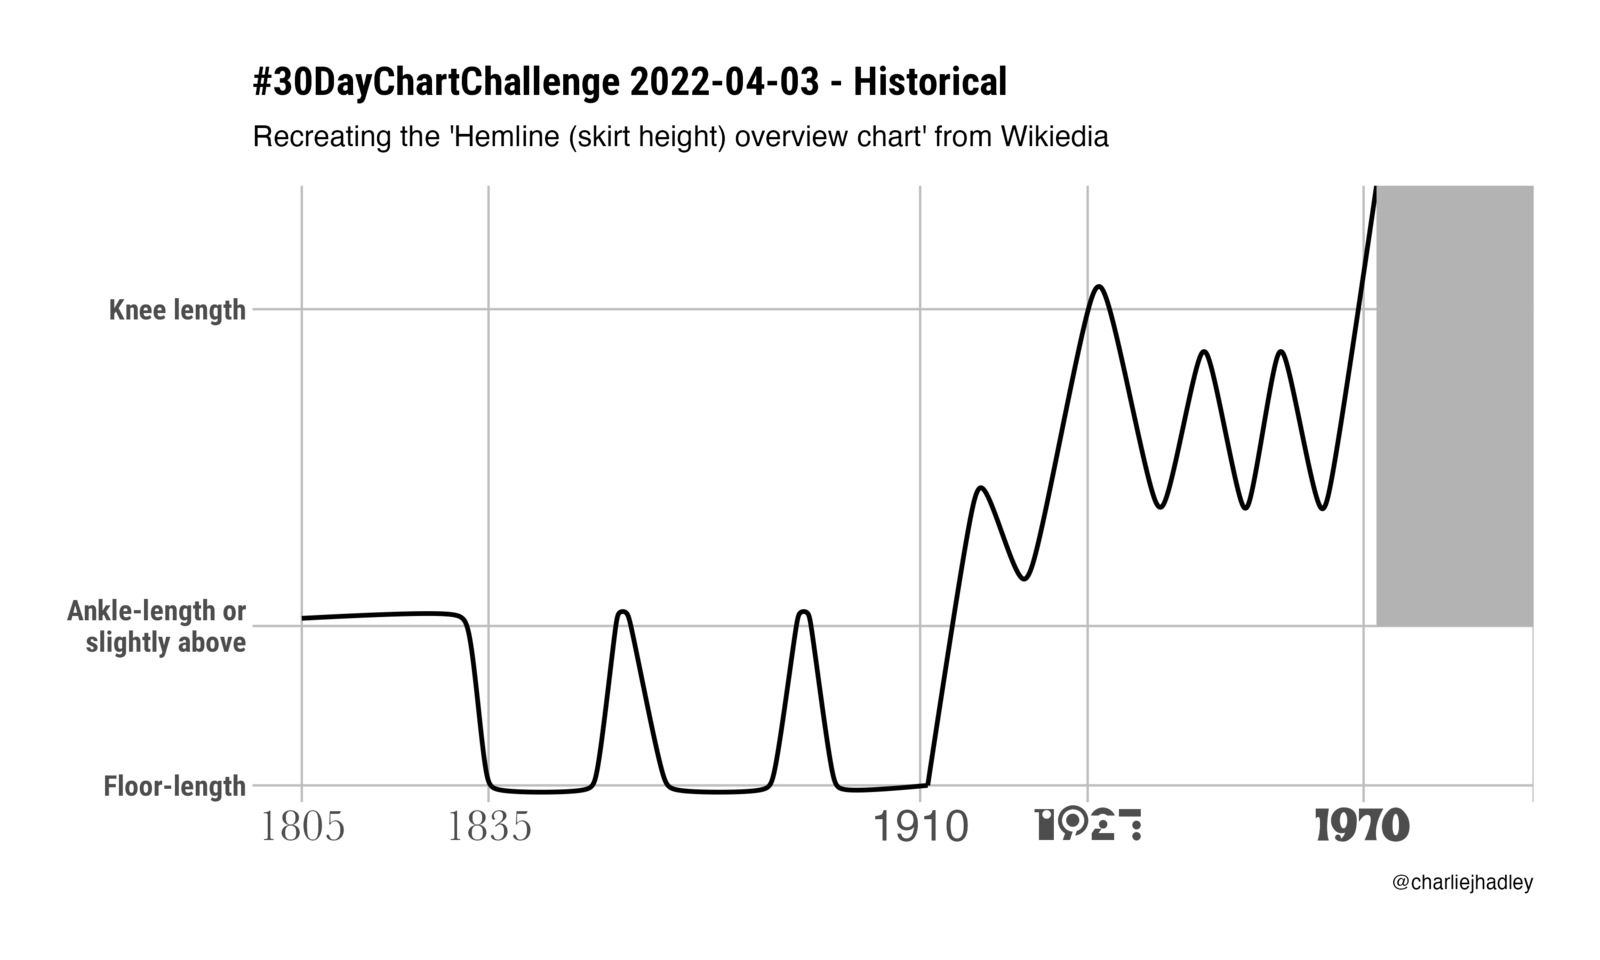
Line chart of skirt hemlines from 1805 to 1970. Hems sit at the ankle until 1835, then stay at floor length until 1910 apart from two brief rises. After 1910 they climb in waves, reaching the knee in 1927, and go above the knee around 1970.
  • #30DayChartChallenge

Historical: skirt lengths

A century and a half of hemlines.

Read the post: Historical: skirt lengths
An advent calendar: a photo of a Santa mug and red polka-dot mugs, covered by a grid of 24 numbered doors. In the animation the doors open one by one, each revealing a Christmas drink such as a caramelised almond brittle latte.
  • Experiment

A ggplot2 advent calendar

Animated doors opening on Christmas drinks, one a day.

Read the post: A ggplot2 advent calendar
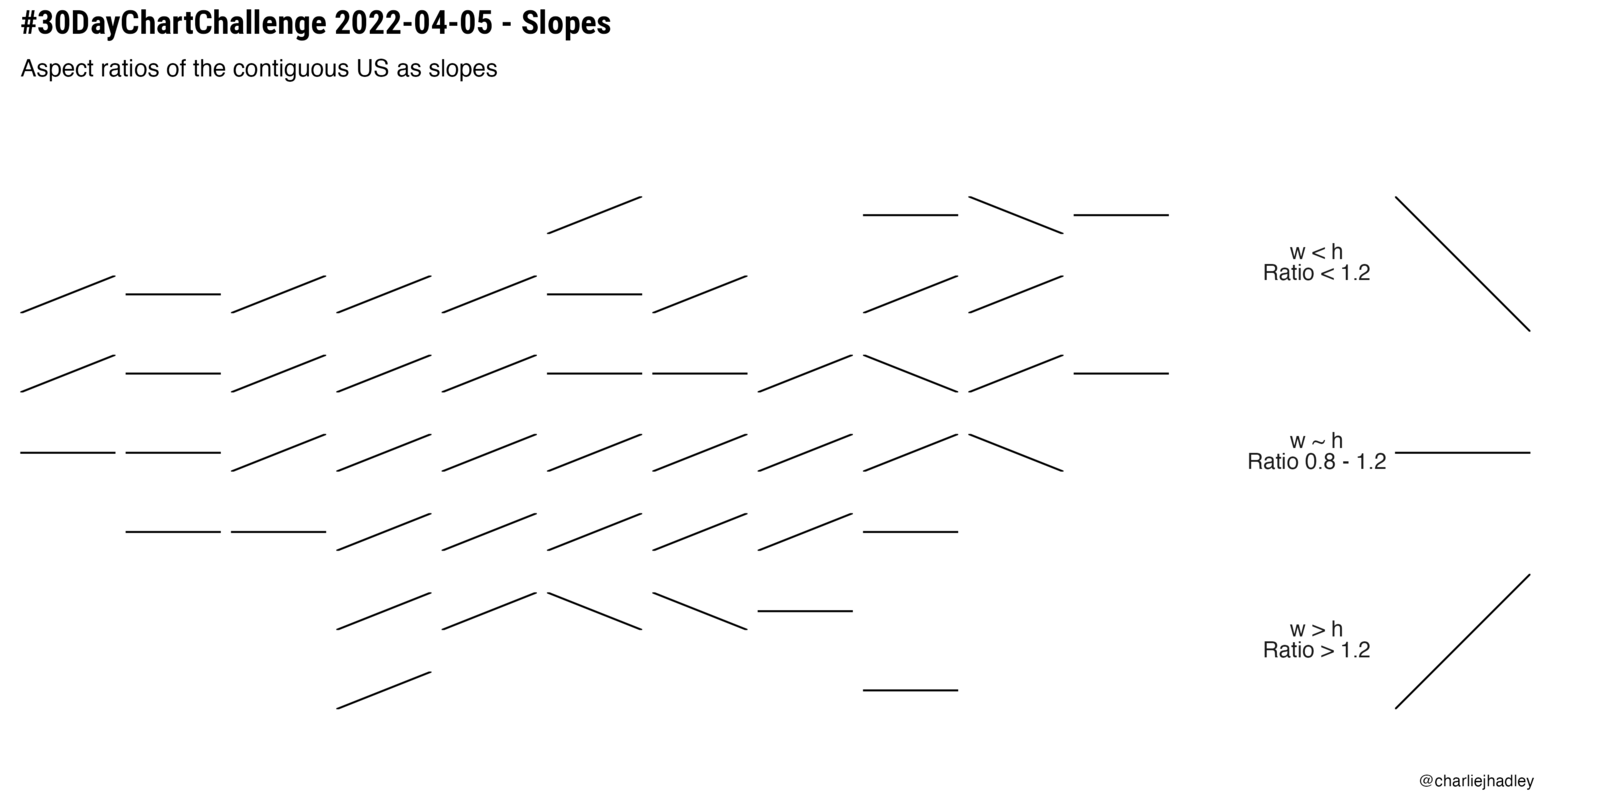
Short line segments, one per state, arranged roughly in the shape of the contiguous United States. A segment slopes up if its state is wider than it is tall, lies flat if the state is roughly square, and slopes down if it is taller than it is wide.
  • #30DayChartChallenge

Slopes: US state shapes

The aspect ratio of each contiguous US state, as a slope.

Read the post: Slopes: US state shapes
A single pink violin shape that looks like an old-fashioned light bulb: a rounded glass bulb with a pointed tip, narrowing to a small screw base.
  • Experiment

A violin chart-like bulb

A violin chart in the shape of a light bulb.

Read the post: A violin chart-like bulb
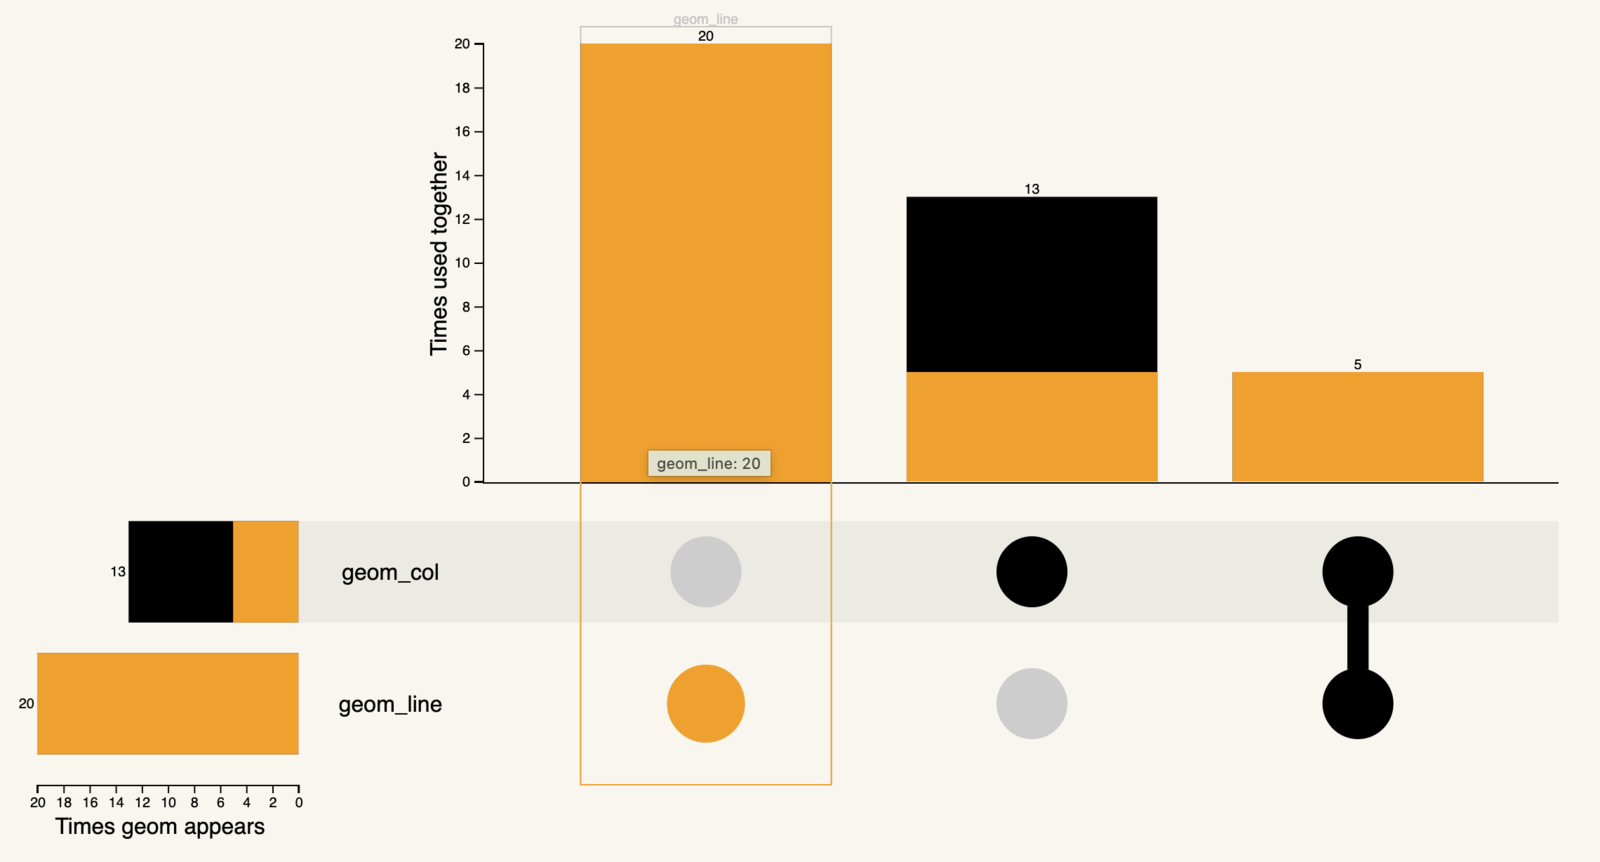
UpSet chart of two geoms. Bars show geom_line used without geom_col in 20 charts, geom_col without geom_line in 13, and the two together in 5.
  • Package

Which geoms go together?

An UpSet chart from {ggplot2wrapped}.

Read the post: Which geoms go together?
No matching items

Training

  • R training
  • AI & Data Ethics
  • For teams
  • 1:1 coaching

Join in

  • Upcoming workshops
  • Free tasters
  • Talks
  • Blog

About

  • About Charlotte
  • Portfolio
  • Get in touch
  • Brand

Elsewhere

  • Visible Data
  • Pier
  • LinkedIn Learning

Charlotte Hadley

Charlotte Hadley home

R, AI and data ethics training. Workshops, not webinars.

© 2026 VizData Consulting Ltd. Registered in England and Wales, company no. [NUMBER], [REGISTERED OFFICE].

  • Privacy policy
  • Booking terms
  • Accessibility statement
 
Cookie Preferences